AI Baseline Analyzer 1.0
Here is a lifelong pain point of my job.
Every time I was asked to analyze and resolve a performance issue with a database, I started with little to no information about what in fact is considered as "acceptable performance". When speaking of performance, you basically tend to balance between budget and service response time. But who is actually able to tell what normal looks like, or where do I get the expected perception of system behavior.
I had to dig every piece of information on my own and get the picture as fast as possible which caused significant amount of effort and took most of the valuable time.
When you don't live with the system each day, you have no idea what a typical use on Monday morning is, or Wednesday afternoon or the 15th of the month or what are your peak hours. When can you schedule maintenance, or... when does the system have a plenty of headroom to place more workload.
Yes, I remember theory of a baseline. And you should always establish one. That gives you an estimation of what is the "expected" value of particular counter in particular time.
The truth is, in practice only a few care creating a baseline before the system is overloaded and accepts no more. And often by that time, it's already too late. It means, it's going to cost you time, money and reputation. When a performance hit occurs, it means you or someone else responsible did not plan the workload or scale the system properly.
That's why I created a tool that onboards me almost instantly. It collects the performance data continuously, generates a baseline for each counter from data of the past and delivers a readable summary so you get the big picture immediately. It even projects your future expected workload. The summary is rendered at the end of each month. Trust me, this is absolutely enough, because who of us has spare time to read vast amounts of data daily or weekly among dozens of other tasks? I emphasize that every Systems Engineer or IT Manager establishes a monthly routine to stay up to date with whats going on in your systems from performance perspective and foresee trends and anomalies.
The purpose of the tool is to keep you informed without ruining your time and life.
The User interface is created with Neon colors. The idea here was - You are actually working, but feel like you are in Vegas! ;-)
Artificial Intelligence is used where it gets tough for a human and thus it makes perfect sense. Analyze thousands rows of data, store them in memory and put in context? For human, impossible. For AI? Peanuts. Its adding context to endless data samples and translates into human language, which you would normally never get. Because no one would pay for extensive data analysis of 50+ counters for every critical system.
Core functionality:
• Collect performance data of a system
• Calculate statistical information - Average, Minimum, Maximum
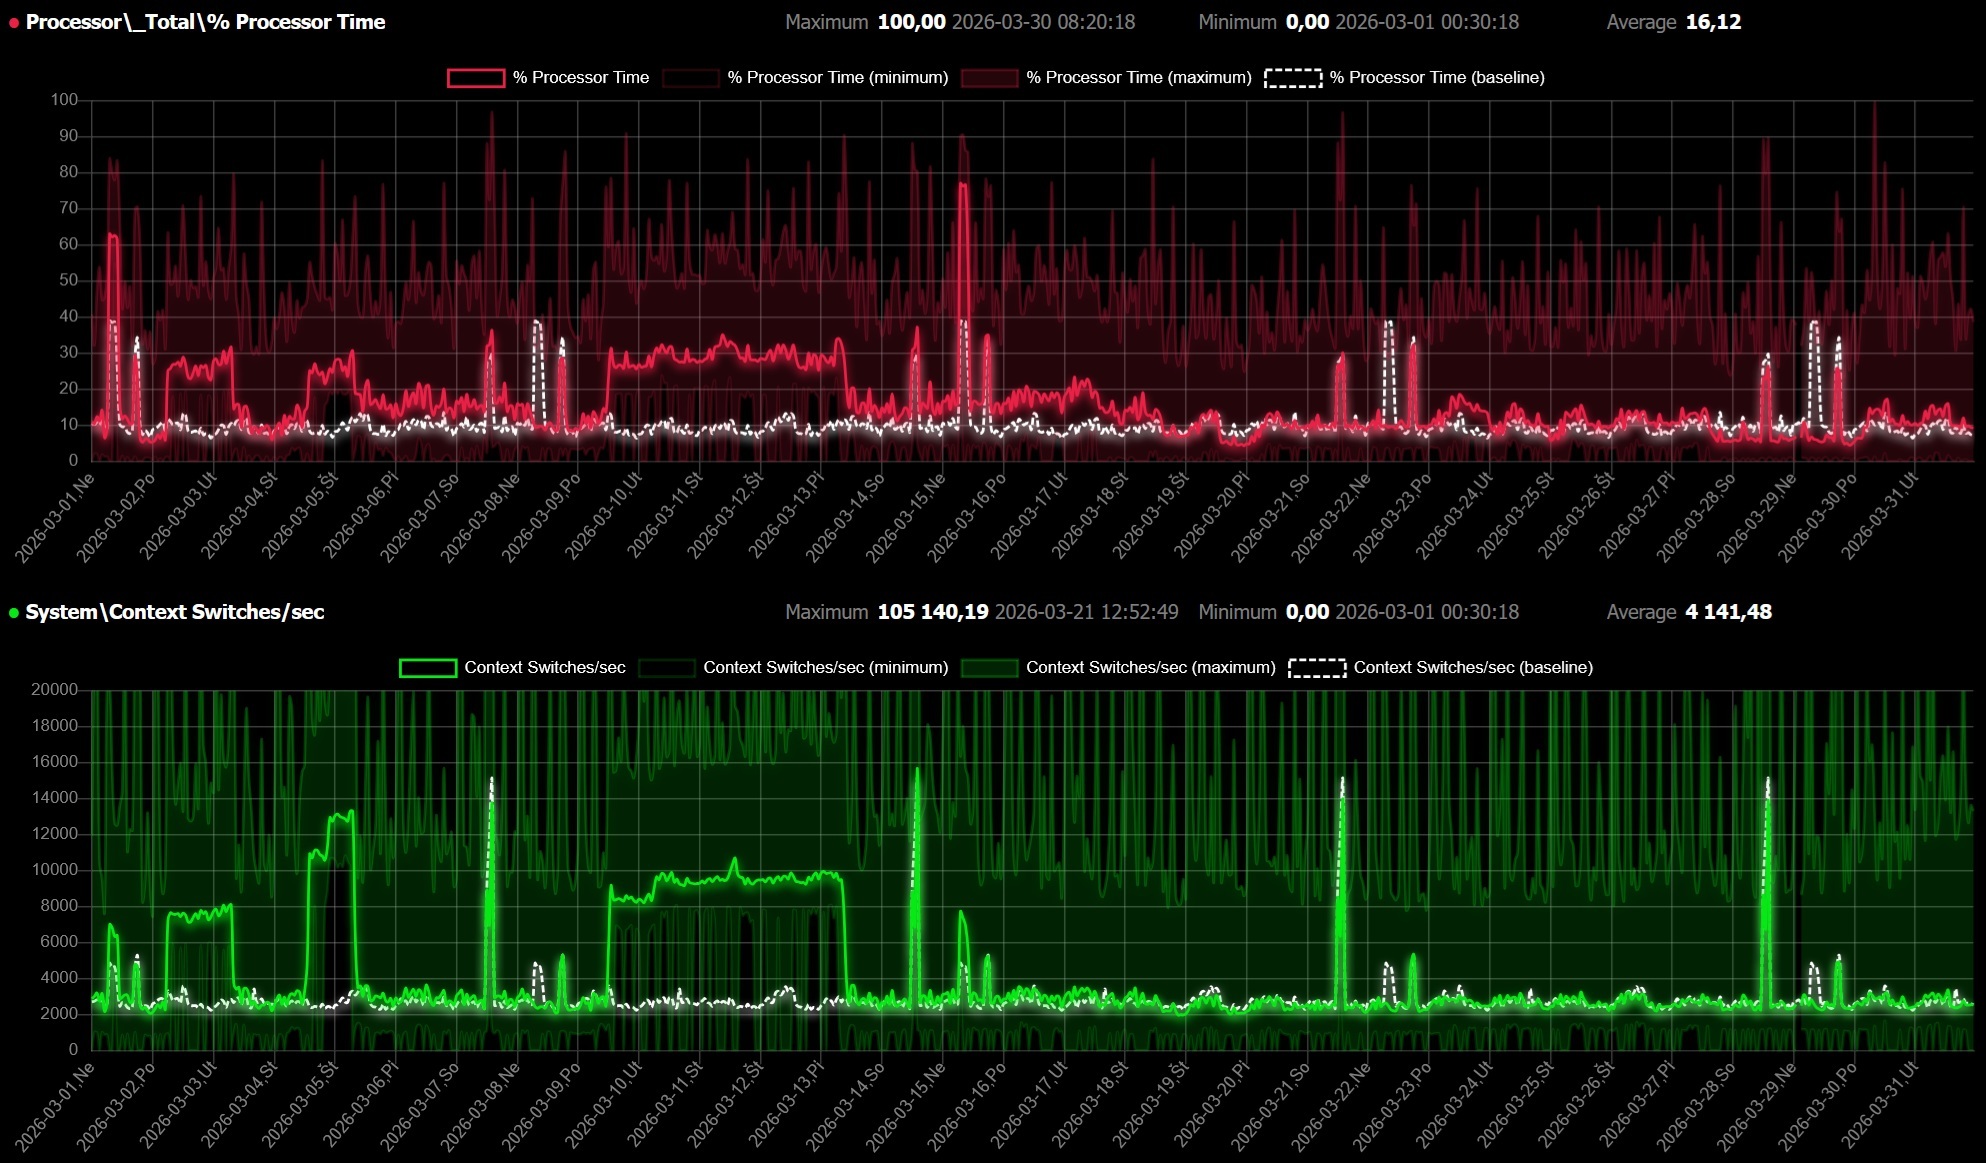
• Shape a baseline for every counter
• Show the range of the counter over time
• Get AI overview with insights from generative AI model
• Receive a comprehensive report
Collect performance data of a system
Performance data of a system is collected continuously, stored in a cache and delivered to the private-cloud within our company. The data is stored with us, and is physically located in the European Union.
Calculate statistical information - Average, Minimum, Maximum
The monthly statistical information - Average, Minimum, Maximum is calculated and added to the report. This way you can keep track of what are your monthly counter edge values. You get an idea what are the peek values of your system.
Shape a baseline for every counter
Show the range of the counter over time
Metrics are sampled in 15-second intervals. This level of detail isn't typically necessary for routine performance trend observation. It’s primarily useful for identifying specific issues with a focus on very short time windows. When analyzing larger timeframes, the data volume becomes substantial and is simplified by averaging to coarser resolutions, such as 15 minutes or a full hour. To avoid losing important information about the peaks and troughs within these intervals, the graph displays the range of metric values. This is shown using a colored fill between the minimum and maximum values, with the metric itself displayed in a slightly darker shade.
Get AI overview with insights from generative AI model
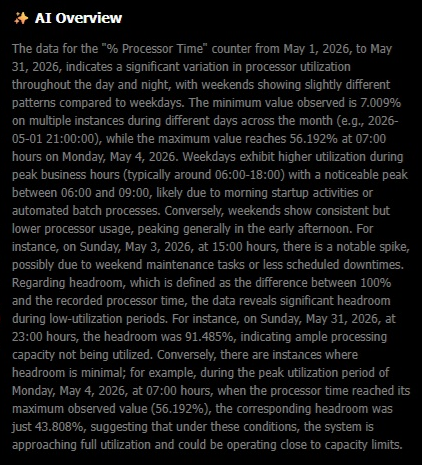
The performance data is fed into generative AI model for overview and insights. Let artificial intelligence do the hard work. You do not mess with reading, describing tons of data into human readable text. Let the beast do what it does best, save your time and enjoy the results.
Receive a comprehensive report
At the beginning of each month, System Performance Report is generated and distributed. This is what you use to understand the big picture. You spend no more than 10 minutes reading the report to get you on track. Everything is in one place, every counter, every baseline, overviews and summary. This is supposed to save you maximum time, yet have excellent view of the systems.
A well-established baseline is even more important in the era, where you face unpredictable workload from agentic systems in your data estate.
When you still don't have baselines of your critical systems, do so and be prepared for the challenges ahead. It may very well warn you before any harm is done.
Supported platforms
Microsoft Windows Server 2016 and above, Microsoft SQL Server 2016 and above
Conclusion
By using the tool and working with stormetric.Ai, you get a chance to have an uncompromising watch of your core and critical systems and compare the system performance month over month, or even Year over Year to support your key business decisions.
If you are curious to learn more, send a request for a live demo session to info@stormetric.ai